
Here’s something we hear from almost every DSO executive we talk to: managing technology across 5, 10, or 20 dental locations is like herding cats. You’ve got different practice management systems, different levels of staff training, different EHR configurations. Now add an AI receptionist to that mix, and suddenly you’re trying to manage call quality, patient satisfaction, and booking rates across locations that all work slightly differently.
The fragmented approach—different vendors, disconnected systems, location-level dashboards you have to log into separately—creates a real problem: visibility disappears. You can’t see patterns. You can’t spot where your AI is excelling or where it’s struggling. And you certainly can’t act fast enough to fix issues before they affect patient experience.
That’s why we built centralized management into Viva from day one. As a founder-led team, we understood that DSO executives don’t want to manage 20 different vendor relationships. You want one reliable partner, one integrated dashboard, and the ability to see everything that matters—in real time.
What “Centralized Management” Actually Means
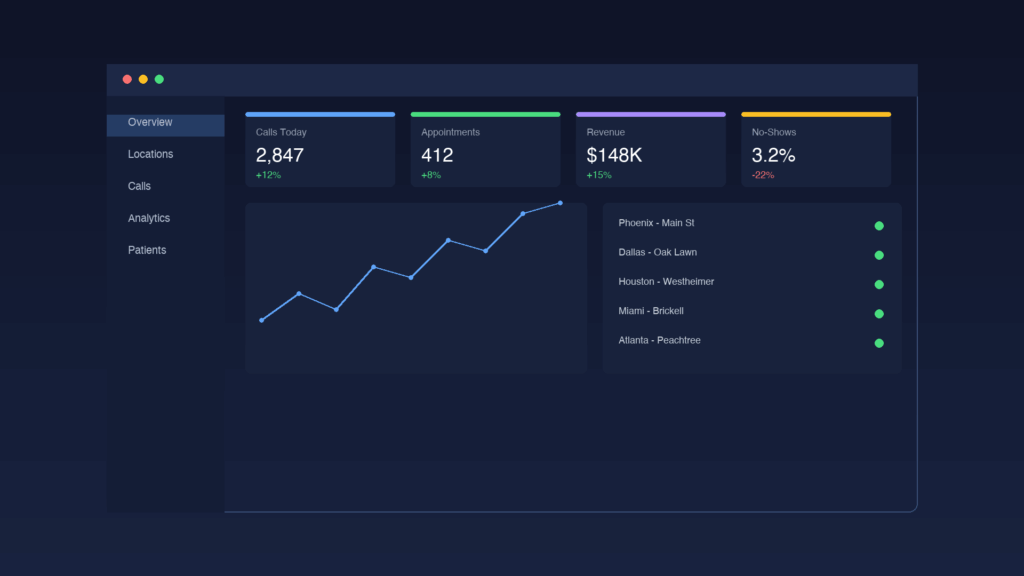
Let’s be specific about what we mean. Viva’s central dashboard gives you:
Unified AI Performance Metrics Across All Locations
Instead of logging into separate vendor portals for each location, you see aggregate performance: call handling rates, average talk time, patient satisfaction scores, and booking conversion rates—all in one view. You can drill down by location, by time period, or by metric. If your downtown location has a 12% higher no-show rate than your suburban practices, you’ll see it immediately. If your AI is booking 78% of new patient calls at Location A but only 62% at Location B, that’s a flag we can help you investigate.
Call Analytics That Actually Tell You Something
We analyze every AI-patient interaction for emotional intelligence signals. Are calls ending positively? Is the AI de-escalating tension? Are patients satisfied with how their questions were answered? Our emotional intelligence approach recognizes these insights matter more than raw numbers. A location with 100 booked appointments but negative sentiment isn’t a win. A location with 80 bookings and genuine patient rapport is. Your dashboard surfaces both metrics so you understand the quality behind the quantity.
Real-Time Patient Satisfaction Tracking
After each call, patients can rate their experience. Unlike traditional CSAT surveys with 8% response rates, our in-call feedback happens immediately—so you actually get data. You see which locations have patients who feel heard, who trust the AI, and who’d recommend the practice. This becomes your leading indicator for case acceptance and patient lifetime value.
Booking Rate Transparency by Location and Practice Type
Your cosmetic implant center might have a different booking rate target than your family dentistry location. The dashboard lets you set different benchmarks by location, compare performance, and identify where your AI is most effective. You’ll spot trends like “our AI books cleanings at 87% but cosmetic cases at only 61%”—which tells you the AI needs better training on high-value case value prop.
Staffing Impact Visibility
When you’re monitoring multiple locations, you need to know: which locations have the best outcomes when their front desk staff work with the AI, versus locations where staff are creating friction? The dashboard shows staff handoff quality, call transfer rates, and whether human staff are completing what the AI started. This helps you identify where you need to double down on training.
The Multiplier Effect of Centralization
Here’s the math that matters to DSO executives:
Let’s say you’re running 10 locations. Each location has an average of 400 inbound calls per month. That’s 4,000 calls across your organization. If your AI improves booking conversion by just 3%, you’ve created 120 additional booked appointments per month across the DSO. At an average case value of $400 per first visit, that’s $48,000 in incremental monthly revenue—and that’s only from booking improvement, not including reduced no-shows, faster first appointment scheduling, or better patient experience.
But here’s what most DSO operators miss: you can’t optimize what you can’t see. If you’re logging into 10 different vendor portals, or if your data is scattered across multiple partners, you won’t spot the opportunities. A centralized dashboard shows you that Location 3 is underperforming. You dig in. You find out the office manager there has scheduled the AI to only handle calls during lunch hours. You fix it. Suddenly Location 3 jumps from 68% booking rate to 84%.
That’s not magic. That’s visibility enabling action.
Comparing Fragmented vs. Integrated
Let’s compare the experience you get with Viva versus the typical “multiple vendors” approach:
Scenario: Your AI booking rate dropped 7% last month.
With fragmented vendors: You notice the dip in your own PMS data. You email Vendor A. They check their logs. They email you back saying “we don’t see an issue on our end.” You email Vendor B asking about call quality. Vendor B asks for specifics. Nobody has a holistic view. Two weeks pass. The problem continues. You lose $40,000 in missed revenue by the time you figure out the AI was being scheduled wrong at two locations.
With Viva’s centralized dashboard: You notice the dip. You log in. You see it’s Location 4 and Location 7 that are down. You drill into Location 4 and see that 23% of incoming calls are hitting a new practice management system error that’s preventing proper scheduling. You see exactly which times this is happening. You contact us with specific data. We escalate. We fix the integration. You’re back to baseline within 24 hours. You lost $2,000 instead of $40,000.
Features That Make Centralized Management Real
We don’t just talk about centralization. Here’s what you actually get:
Multi-Location Role-Based Access
Your regional directors can see their regions. Your location managers see their locations. Your C-suite sees everything. You control who sees what data, which is essential for DSO governance and accountability. This control becomes critical when you’re launching outbound campaigns across multiple locations with different approval workflows.
Configurable Alerts and Thresholds
Set booking rate targets, patient satisfaction baselines, and call handling standards. If any location drops below threshold, you get a notification. Your team can respond proactively instead of reactively.
Exportable Reports and Dashboards
Need to present to your board? Need to analyze trends in your BI tool? Export the data. We make it easy because we know you’re using multiple systems. Language-specific analytics can also be exported to understand performance across diverse patient populations.
Integration with Your Existing PMS
We pull booking data, patient info, and appointment data directly from your practice management system. You don’t need to manually reconcile anything. The data flows both directions—when our AI books an appointment, it goes directly into your PMS at every location simultaneously. This native integration is a key difference between unified systems and fragmented vendor stacks.
Location-Level Customization with Central Oversight
Each location has its own AI personality, greeting, and scheduling logic—but you can enforce standards from the center. Every location’s AI must ask for insurance info, for example. But Location A’s AI can emphasize same-day availability while Location B emphasizes weekend appointments based on their patient base.
What This Means for Your Bottom Line
The real value of centralized management isn’t just visibility. It’s the compounding effect of small improvements across all your locations.
If you run 15 locations and your centralized dashboard helps you improve AI booking conversion from 72% to 76% (a 4% gain), you’ve created roughly 240 additional booked appointments per month across your DSO. At $450 average case value, that’s $108,000 per month in incremental revenue. Annualized: $1.3M.
That’s one metric. Patient satisfaction improvements drive case acceptance. Better data drives smarter scheduling. Visibility drives faster decision-making. These compound.
We’ve seen DSO operators tell us: “Before Viva, I had a black box at each location. Now I have one window into all of them. I know exactly where we’re winning and where we’re not.”
The One Caveat We’ll Mention
Centralized management is only valuable if the underlying AI is solid. You can have the world’s best dashboard showing that your AI is terrible at converting calls—but that doesn’t help you. The good news: Viva’s underlying AI is designed to handle the complexity of dental practices. We’ve trained it on thousands of real dental conversations. It understands case difficulty, urgency, and patient psychology. The dashboard just makes that performance visible and actionable across your entire organization.
Ready to See What You’ve Been Missing?
If you’re running a DSO, you already know that visibility drives accountability, and accountability drives results. Viva’s centralized management gives you that visibility—one dashboard, every location, real-time insights, and the power to act.
Every location deserves an excellent AI receptionist. But your DSO deserves to know how that receptionist is performing.
See your entire DSO’s AI performance in one dashboard.